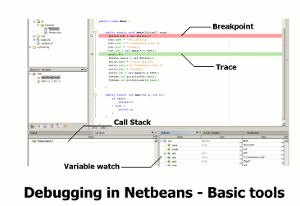
Debugging tools
Debugging is the process of finding and eliminating bugs within your code. This can be done by using test data or simply reading the code. However this is not always the best way. Most integrated development environments (IDEs) have special tools in order to help the programmer.
The most common tools are -
- Variable watches
- Breakpoints
- Trace (stepping through code)
- Stack traces
Variable watch - Allows you to see the value of variables at any point in your program. In conjunction with breakpoints and trace allows you to see how variables change.
Breakpoints - Will stop a program at the breakpoint to allow a trace to start. You can set breakpoints at any point in your code apart from variable declarations
Trace - Allows you to step into your code. Step into will jump into any procedures you may have. Step over will not do any jumping.
Stack traces - When procedures are called they are put onto the stack. A stack trace, or call stack, will show all of the functions called and the line number they were called from.


